ddplot
This simple program visualizes relative displacements in dislocated crystals using
differential displacement maps. In this projection, the displacements are depicted as arrows
whose lengths correspond to the relative displacements of the neighboring atoms. The output is given
as a Postscript figure, animation, .XYZ file for JMol or standard .CFG for AtomEye.
Main features:
plotting of atomic structure
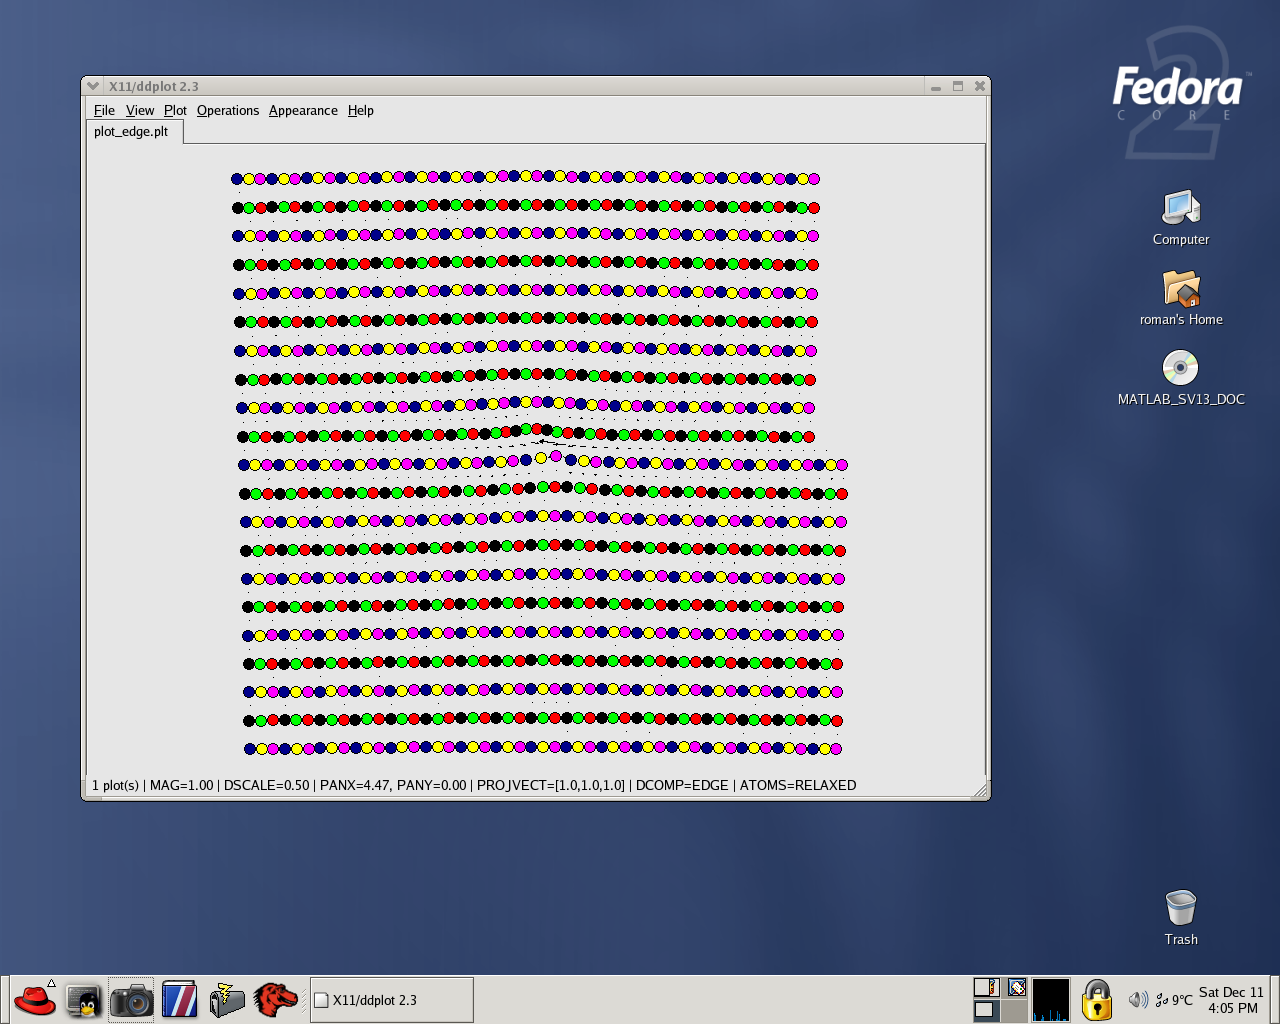
visualization of screw and edge components around a dislocation
line
projection of relative displacements into an arbitrary
direction
scaling of arrows (for the plotting of edge components)
automatic finding of the first to fifth nearest neighbors
unrelaxed/relaxed configuration
coordinate transformations
output to Postscript, .XYZ (JMol), standard .CFG (AtomEye)
group loading of a set of plot files
internal .DD format containing the coordinate system, position of the
dislocation, lattice parameter, etc.
creating a .GIF animation from the uploaded blocks
changing colors, line thickness and radii of atoms and arrows
distinguishing atomic layers or atomic types
user-defined settings can be stored in ~/.ddplot or loaded at the start
Screenshots:
Download:
Sources:
 ddplot-2.5-src.tar.gz
(released on October 28, 2005)
ddplot-2.5-src.tar.gz
(released on October 28, 2005)
no error about MAX_NEIGHBOR occurs when NeighRCut is too large - instead ddplot asks
user to input a smaller cut-off radius for the plot to be displayed
ddplot can display a coordinate system of the block (Ctrl+C)
several bugs related to the transformation of coordinates corrected
when started in the verbose mode 'ddplot -v', ddplot will show where in the code an error has
occurred (the line starts with an exclamation mark '!')
ddplot-2.4-src.tar.gz
it is possible to select particular Z-layer(s) for which the
differential displacements are to be plotted
magnitudes of differential displacements are printed also for edge dislocations
flipping the picture about X, Y or Z axis
neighbors are now searched using the linked neighbor list. The same holds for the RDF => the
time to plot the structure decreased tremendously for large blocks.
fixed wrong plotting of the atomic numbers (used to be numbered from 0, now from 1)
calculation of the RDF has been fixed - it is now fully 3-D
bounding box fixed - it is read using gs and replaced in the generated PS file
correct identification of the same layer if the Z-coordinate for two atoms is not exactly the
same number - the tolerance is 1e-4 - e.g. atoms with Z-coordinates 0.4999 and 0.5 are taken to
pertain to the same layer. This makes sure that the plot does not contain a bunch of differently
colored atoms.
plotting of grain boundaries - automatically recognized that the .PLT file contains a grain
boundary data and shows the grain boundary as a line
can read directly the block of BOP (e.g. block.out) - just change the wildcard at the bottom
of the Open file dialog and find the block(s) you wish to display
information about the relaxation of the block which is inserted at the end of the .PLT file can
now be displayed directly in ddplot (no editing allowed)
ddplot-2.3-src.tar.gz
ddplot-2.2-src.tar.gz
Installation:
To install and compile ddplot from the sources above, you will first need to download the Qt library (version 3.3+ strongly
recommended). You can either get the pre-compiled libraries (in case you find them for your platform
somewhere on the web) or you can always download sources from the link above and compile the Qt
library yourself. If you plan to do the latter on your Linux computer, you will also need the X11
development package XFree86-devel (Redhat 9) or x11-dev (Fedora Core). Mac users need to install the
Apple Developer's Toolkit that comes with your MacOS X system CDs. I haven't yet figured out how
to compile ddplot on Windows (ask me later or let me know if you succeed).
In case you want to compile the Qt library, I advise you to do a static build. This can be done by
going into the Qt home directory (presumably /usr/local/qt*). Become the root by su root
and run the following commands:
./configure -static
make
make install
List the contents of the bin subdirectory - you should see a lot of executable files, among
them also qmake. At this point, you have successfully finished compiling the Qt library
from sources.
Proceed by downloading the newest source of ddplot from above and unpack it:
tar -xzvf ddplot-*-src.tar.gz
where the asterisk (*) replaces the version number. Go to the directory ddplot where you will find
many .cpp files, ddplot.pro, INSTALL and HISTORY files. You will first need to create a Makefile for
your platform which will be based on the information in ddplot.pro. This is simply done by running:
qmake
If no error message appears, Makefile is successfuly created. However, if there is some error, you
probably don't have gmake. This executable usually lives in the directory /usr/lib/qt/bin. If not,
you have probably installed Qt from some basic binary; this time you will have to download the Qt
library again (it is free for noncommercial purposes) and compile it manually as explained above. If
you are the lucky one and the Makefile has been smoothly created, compile the sources by running
make
This will now take a while. The compiled ddplot executable for your platform will be stored in the
same directory.
Feel free to make any changes to suit the code to your needs and feels. If you do some major change
that you think may be of interest also for other users, send me your sources and I will prepare a
new release involving your modifications and additions.
Also, review the supplied .ddplot file (it is in the ddplot directory) containing
the user settings and copy it into your home directory. During the start of ddplot, the program
first looks for .ddplot in your home directory and then in the current directory. If it does not
find the file, the default settings will be used. You may find useful to use different settings for
different plots, e.g. one .ddplot for plotting TiAl structures, another for simple bcc metals. In
that case, create more .ddplot files and start ddplot as:
ddplot -f .ddplot-tial
for example. The comments in .ddplot are rather insufficient - in some later release, I shall
put in all commands together with their complete description.
Contact:
xalbert76@gmail.com (Roman Gröger)
To keep you updated about new versions of ddplot, send me your e-mail and I will add you into the
ddplot mailing list. I will be glad to hear about your experience with ddplot, your suggestions but
also criticism. If you have some nice figures from ddplot, please, send me .JPG or .GIF to put them
here as screenshots.