Michael J. Therien, Ivan J. Dmochowski, and Daniel A. Hammer, (2011)
 Composites are a means of designing the material properties of an assembly through collective interactions. Here we show that we can make a color-changing stress sensor within the membrane of of a synthetic capsule. Porphyrin molecules – macromolecules that emit light depending on their configuration – are embedded in the membrane of a synthetic capsule made of polymer. When the membrane is stressed in a glass tube under regulated pressure, the stretching of the membrane induces a conformational change in the porphyrin and a change in the color it emits. By directly relating the membrane stress to to the color, we can calibrate the stress sensor. The linear correlation between stress and change in wavelength of light means that an optical detector can be used to measure stress.
Neha P. Kamat, Zhengzheng Liao, Laurel E. Moses, Jeff Rawson, Michael J. Therien, Ivan J. Dmochowski, and Daniel A. Hammer, Proceedings of the National Academy of Sciences USA, 2011
Figure:
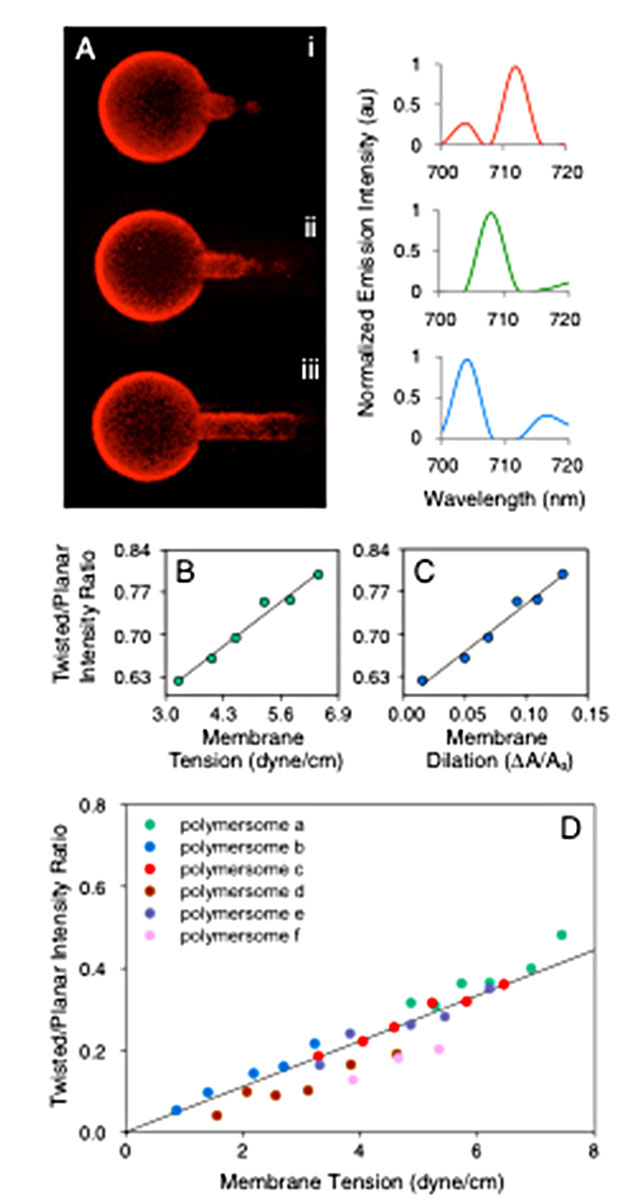
(A) Aspiration of a polymersome membrane into a micropipette results in a blue shift of PZn2 emission in response to the applied membrane stress. Increasing the tension in the polymersome membrane from (a) 0.8 dyne/cm to (b) 1.7 dyne/cm to (c) 4.7 dyne/cm, causes embedded porphyrin fluorophores to shift emission to lower wavelengths. Scale bar is 30 µm (B) The fraction of PZn2 fluorophores in a twisted state linearly increases in response to increasing membrane tension. The ratio of emission intensities at λtwisted = 690nm to λplanar = 730 nm was determined using a PMT and 730 ± 10nm and 690 ± 10nm band pass emission filters. (C) Applied tension through aspiration causes a lateral area expansion of the membrane and results in a porphyrin blue shift for embedded PZn2 fluorophores. The increase in membrane area that occurs upon aspiration of the polymersome scales linearly with the increase of fluorophores in the twisted state. Linear fits give R2 values of (B) 0.97 and (C) 0.98. (D) The adjusted 690nm/730nm intensity ratios for several polymersomes undergoing aspiration are plotted. The increase in PZn2 intensity ratio with applied tension occurs at a similar rate, as demonstrated by the similar slopes of intensity ratio vs tension curves. The average slope, calculated from the best-fit line of each polymersome, is displayed on the chart.